Skip to Main Content

Data Vizualization (Showcase Workshop)

Quantitative Data

> Quantitative data can be:

  • counted
  • measured

It's ... NUMERICAL!


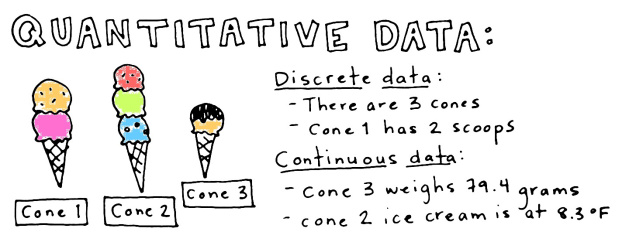
> Examples of quantitative data include:

  • the weight of VW buses
  • the wingspan of eagles
  • the number of cars passing through an intersection each hour

> What's CONTINUOUS quantitative data?

  • there's an infinite number of possible values for each outcome
  • when you take measurements, it's usually continuous data you're finding!

But...but...

  • You're right! - that doesn't mean the range of values you'd measure would be infinite.


> Examples of CONTINUOUS quantitative data include:

  • the surface water temperature of the Lincoln Park swimming pool (64.1, 62.8, 63.5, 65.0 ºF)
  • the hopping height of your pet jackrabbit (1.86, 2.41, 2.09, 2.11 m)
  • the weight of CMU football players


> So while there's likely an upper limit to the weight of a CMU football player...there's an infinite # of exact hopping heights that could be measured.

> What's DISCRETE quantitative data?

  • data with a limited # of possible outcome values
  • when you are counting sometime to collect data, it's often discrete!


> Examples of DISCRETE quantitative data include... 

  • # of passengers in a car
  • # of phone calls an office receives each day
  • # of puppies in a litter
  • # of credit hours registered for per student per semester

> Interval

  • Intervals between values are known
  • Intervals between values are equal
  • Example: temperature
    • Interval from 50°F to 60°F is known
    • Interval from 50°F to 60°F and 80°F to 90°F is equal
  • Where might I see INTERVAL data: usually within data collected in environmental science


> Ratio

  • A special case of INTERVAL data
  • Interval data that starts at 0
  • Where will I see RATIO data: environmental science - experimental research
    • Example: rainfall
      • starts at 0 inches (can't have negative rainfall!)
      • difference between 2 and 4 inches is known
      • difference between 2 and 4 inches = difference between 10 and 12 inches
    • Example: whale mass
      • starts at 0 (though no whale will weigh 0, they couldn't weigh LESS than 0!)


> Ordinal 

  • data has a relevant order
  • magnitude between values is unknown or unequal
  • When will I see ORDINAL data: survey data with ranked responses
  • Example: a satisfaction scale
    • scale from 1 to 5 (with 5 as highest satisfaction)
      • 5 = better than 3
      • 4 = better than 2
      • difference between 5 & 3? unknown
      • difference between 4 & 2? unknown
    • There's an order but the interval differences aren't necessarily meaningful

Where'd You Find this Good Info?